Don't expect any test results for a few days, because this is what the Windows XP Disk Defragmenter (WDD) is having to deal with: 75% full hard drive with a lot of fragmented files, both large and small, including big compressed files with lots of fragments.
The test PC has been set up to look like a home PC that hasn't seen a defrag in its life before. This isn't too far off the mark. Since WDD is supplied with WinXP, it gets to go first. Then I will move on to Vista's built-in defrag utility, and take a peek at the Windows 7 version.
There is no time limit on how long the defrag will run. The goal is better performance, since most people leave the defrag running overnight or when they are out.
Update Sunday 1 March: As I start noting the results of the benchmarks, I have coined the term "the slouch factor" to describe what happens when a hard drive gets full. We've all noticed how a Windows machine usually feels slower after a long time of use, and as the drive gets full. There is an explanation for this, best described by Robert Ferraro of DiskTrix, in the "Hard Drive Performance Theory" section of the UltimateDefrag help file.
You can see it in the graph above: data transfer rates drop from 76MB/sec down to around 40MB/sec as you move from the start of the drive to the end. When I ran my previous Defrag Shootout, I was using a drive that had two partitions, courtesy of Acer. The first (and therefore faster) partition had the OS and temporary file space, while the second had data files. It seems that Acer was being clever by doing this, because the slouch factor is caused by the position of working (or temporary) files. When there is free space near the start of the drive, the temporary files can be manipulated there, with faster seek times and data transfer rates.
As the drive fills up and is kept "tidy" by a traditional defrag program like WDD, the position of the available free space gradually moves towards the slow end of the drive, affecting the seek time and transfer rates of new and temporary files. The computer starts to slouch, hence the slouch factor.
Friday, February 27, 2009
PCMark 05 Benchmark Test Results
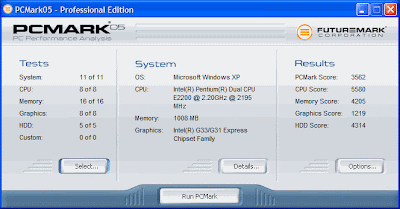
I digressed from the task at hand to run some tests on the PcMark 05 benchmarking program. The results are shown in order of testing. High score is best.
First, I ran the program with the initial file layout, and a minimal install. Not surprisingly the HDD score is lowest, because the drive is fragmented.
Initial setup: 4453 points. No defrag.
After Windows Disk Defrag: 4448 points. This is the recommended configuration. The hard drive has been defragmented using the standard WDD program.
After JKDefrag -a5: 4493 points. This is the best result, obtained by moving all the files to the start of the drive, leaving the rest of the drive completely open.
After JkDefrag -a 3: 4474 points. The second best result, obtained using the standard configuration adopted by JkDefrag, with a 1% open space at the start of the drive, followed by another 1% after the "program" files.
After JkDefrag -a 6: 4471 points. All the files have been moved to the slow end of the drive, with almost no performance penalty.
In theory, the last result would be the worst result if actual file performance was being measured, since all the files are in the slowest part of the drive. Conversely, it would be the best result if the trace results were being used, since the entire start of the drive would be available for reading or writing, and so it would match the reference system perfectly.
Now look at the actual performance graph of the drive, measured by HD Tune. There are some clear sectors at the beginning of the drive that run much slower. Presumably these sectors were damaged and have been swapped out for other sectors, but it is impossible to know for sure without an inspection of the drive that I don't have tools to perform.
These "glitch" sectors may account for the drop in 20 points (0.4%), but in any case the overall variation between high and low is all within a 1% range, and so could well fall within a measuring error.
My conclusion: the benchmark does not significantly determine any effects caused by file placement or fragmentation when the drive has a minimal install, i.e. just Windows XP, DirectX and the PCMark 05 software. So MaximumPC's conclusions are flawed because of the way they measured the effects of the defrag program. The PCMark benchmarks don't claim to measure the effects of fragmentation: they are designed to compare the hardware configurations of a wide variety of PCs. "The Disk Defrag Difference" was a good idea. Hopefully my tests will give a better result. We can only be patient and see what transpires.
Tuesday, February 24, 2009
Maximum Misunderstanding about Defrag Benchmarks
Last year MaximumPC wrote an article, "The Disk Defrag Difference" in which they claimed that the defrag programs that they tested were not much better than the built-in defrag program in Windows Vista.
They used the HDD benchmarks in PCMark Vantage to see whether a given defrag program would improve the PCMark score or not. Unfortunately they didn't read the fine print. I stumbled apon it by accident, so I can't criticise them too much. You have to read the PCMark05 Whitepaper quite carefully to find it. Page 17, under the heading "HDD Tests" (emphasis added):
In order to benchmark the "write" activity, the original reference system could have written data to cluster 1020, 1021 and 1022. On my system these clusters may be in use, so the benchmark program finds the "nearest" available clusters, say 1200, 1201 and 1203, and does its timing accordingly. It's the only safe way to do a "write" benchmark without corrupting the test system, so from PCMark's point of view, it's close enough.
In my example, notice that cluster 1202 is not available, and this could ruin the benchmark's measured performance, depending on the characteristics of the drive. That's why they say that the benchmark should be run on a defragmented system.
So when I run a PCMark HDD benchmark on my system, I am comparing the read speed of my hard drive to the read speed of the reference system's hard drive. Similarly, I am comparing write speeds, with the exception that the software will use available empty space on mys system, rather than the actual space used on the reference system. It's a limitation of the software, but is required for safety purposes. The benchmark results bear no resemblance to the actual location of system files on the test system, only the location of free disk space.
So in effect MaximumPC was measuring the ability of each defrag program to create free disk space where the benchmark required free space, based on the write patterns of the reference system. This is not the same as measuring the improvement in file placement and thus performance boost claimed by the defrag software.
It's incredibly difficult to measure a "performance gain" on a Windows system in any kind of objective way. I'm still not convinced I have the answer, but time will tell. Raxco have a utility called FileAccessTimer, and Diskeeper refer to readfile in some of their literature.
A package that reads all the files on a PC and times them doesn't help either, because it will read both the "fast" files and the "slow" files, so these will balance one another out. I would love to find a way of timing how long it takes to open a Word document or Excel spreadsheet, but have yet to figure out a way of doing this accurately. Maybe I'll have to write one.
Update Wednesday 10am: I realised that I can create an Excel document that displays the current time, calculated on opening. I can do much the same on an Access data file. So now I have written a very simple VB utility that displays the time and then opens a requested file:
Update 2: It seems that Word 2007 and Excel 2007 return control back to the VB program after they have opened the file requested. This enables me to get the launch time accurate to the nearest 10th of a second. Since Access97 already has the "Timer" function built in, the accuracy is maintained there too. I am also including my SMSQ "Stress Test" program in the benchmarking mix.
Test Results: see article above, and more results collected. It turns out the results can be measured within a 15% variation, using an average of 10 measurements taken to the nearest 100th of a second.
They used the HDD benchmarks in PCMark Vantage to see whether a given defrag program would improve the PCMark score or not. Unfortunately they didn't read the fine print. I stumbled apon it by accident, so I can't criticise them too much. You have to read the PCMark05 Whitepaper quite carefully to find it. Page 17, under the heading "HDD Tests" (emphasis added):
For these tests, we use RankDisk, an application developed and copyrighted by Intel®. In our testing, we found RankDisk to be suitable for a neutral benchmark. RankDisk is used to record a trace of disk activity during usage of typical applications. These traces can then be replayed to measure the performance of disk operations for that usage.Bear in mind that the PCMark benchmarks are written to compare different systems to one another to see which one is faster. So it makes sense for them to record a "trace" of disk activity, and then try to emulate it on various systems. But the "trace" data does not refer to files on the test system, only clusters. In other words, the original reference system may have had a system file like user.dll that was loaded from clusters 25,26 and 27. When the HDD "read" benchmark runs on my system it reads clusters 25,26 and 27, irrespective of the location of my copy of user.dll, which could be stored on clusters 127, 254 and 55 if it was fragmented.
RankDisk records disk access events using the device drivers and bypasses the file system and the operating system’s cache. This makes the measurement independent of the file system overhead or the current state of the operating system. In replaying traces, RankDisk always creates and operates on a new “dummy” file. This file is created in the same (or closest possible) physical location of the target hard disk. This allows the replaying of traces to be safe (does not destroy any existing files) and comparable across different systems. Due to the natural fragmentation of hard disks over time, they should be defragmented before running these tests.
The traces used for each test were created from real usage. The traces contain different amount of writing and reading on the disk; total ratio in the HDD test suite disk operations is 53% reads and 47% of writes.
In order to benchmark the "write" activity, the original reference system could have written data to cluster 1020, 1021 and 1022. On my system these clusters may be in use, so the benchmark program finds the "nearest" available clusters, say 1200, 1201 and 1203, and does its timing accordingly. It's the only safe way to do a "write" benchmark without corrupting the test system, so from PCMark's point of view, it's close enough.
In my example, notice that cluster 1202 is not available, and this could ruin the benchmark's measured performance, depending on the characteristics of the drive. That's why they say that the benchmark should be run on a defragmented system.
So when I run a PCMark HDD benchmark on my system, I am comparing the read speed of my hard drive to the read speed of the reference system's hard drive. Similarly, I am comparing write speeds, with the exception that the software will use available empty space on mys system, rather than the actual space used on the reference system. It's a limitation of the software, but is required for safety purposes. The benchmark results bear no resemblance to the actual location of system files on the test system, only the location of free disk space.
So in effect MaximumPC was measuring the ability of each defrag program to create free disk space where the benchmark required free space, based on the write patterns of the reference system. This is not the same as measuring the improvement in file placement and thus performance boost claimed by the defrag software.
It's incredibly difficult to measure a "performance gain" on a Windows system in any kind of objective way. I'm still not convinced I have the answer, but time will tell. Raxco have a utility called FileAccessTimer, and Diskeeper refer to readfile in some of their literature.
A package that reads all the files on a PC and times them doesn't help either, because it will read both the "fast" files and the "slow" files, so these will balance one another out. I would love to find a way of timing how long it takes to open a Word document or Excel spreadsheet, but have yet to figure out a way of doing this accurately. Maybe I'll have to write one.
Update Wednesday 10am: I realised that I can create an Excel document that displays the current time, calculated on opening. I can do much the same on an Access data file. So now I have written a very simple VB utility that displays the time and then opens a requested file:
Private Sub Form_Load()Unfortuantely it is only accurate to the nearest second, so I'm not sure how useful it will end up being. Time will tell.
Dim strCommand As String
strCommand = Command()
Form1.txtTimeDisplay.Caption = Format(Time(), "HH:nn:ss") _
& vbCrLf & Timer
Form1.txtFileName = Trim(strCommand)
Form1.Refresh
Call OpenThisDoc(Form1.hwnd, strCommand)
Form1.txtTimeDisplay2.Caption = Format(Time(), "HH:nn:ss") _
& vbCrLf & Timer
End Sub
Update 2: It seems that Word 2007 and Excel 2007 return control back to the VB program after they have opened the file requested. This enables me to get the launch time accurate to the nearest 10th of a second. Since Access97 already has the "Timer" function built in, the accuracy is maintained there too. I am also including my SMSQ "Stress Test" program in the benchmarking mix.
Test Results: see article above, and more results collected. It turns out the results can be measured within a 15% variation, using an average of 10 measurements taken to the nearest 100th of a second.
Saturday, February 21, 2009
Getting closer to the 2009 Defrag Shootout
I wish I had some results to report, but alas progress has been much slower than I thought it would be. Part of the delay was caused by my purchase of Acronis TrueImage Home 2009, which sucks. And their support is not much better, but I digress.
So far I have set up the FRAGG benchmarking computer with images of three operating systems: Windows 5, 6 and 7, normally known as WinXP, Vista and 7. Each one has been backed up using an older version of TrueImage, on a sector-by-sector basis.
I have tried out various benchmarking packages, some of which don't work on this particular system. I also tested Microsoft Live Mesh, which I used to copy files in the background while downloading others. But Live Mesh is beta software and it managed to fill up the hard drive with a duplicate copy of my audio book collection.
The first set of results I will publish will be for all the various benchmarking programs, on Windows XP with around 65% fragmentation. The reason for publishing these first is to establish a "dodgy system" benchmark that the various defrag programs can attempt to fix.
JkDefrag's drive map shows how fragmented the XP drive has become. At the risk of complete numerical overload, it reports:
Total disk space: 160,031,014,912 bytes (149.0405 gigabytes), 39,070,072 clusters
Bytes per cluster: 4096 bytes
Number of files: 74,914
Number of directories: 7009
Total size of analyzed items:
122,673,623,040 bytes (114.2487 gigabytes), 29,949,615 clusters
Number of fragmented items:
9457 (11.5438% of all items)
Total size of fragmented items:
80,863,391,744 bytes, 19,742,039 clusters, 65.9175% of all items, 50.5298% of disk
Free disk space:
37,317,713,920 bytes, 9,110,770 clusters, 23.3191% of disk
Number of gaps: 37,779
Number of small gaps: 17,742 (46.9626% of all gaps)
Size of small gaps:
472,133,632 bytes, 115,267 clusters, 1.2652% of free disk space
Number of big gaps:
20,037 (53.0374% of all gaps)
Size of big gaps:
36,845,580,288 bytes, 8,995,503 clusters, 98.7348% of free disk space
Average gap size: 241.1596 clusters
Biggest gap:
2,785,415,168 bytes, 680,033 clusters, 7.4641% of free disk space
Wednesday, February 11, 2009
SQL Server 2008 Express Installation Checklist
It may be available for free download, but SQL Server 2008 Express has cost a lot of time, and therefore money. The installation itself is tedious and requires numerous downloads and prerequisites. Then there is the problem of the "reboot required check" that fails for the wrong reason.
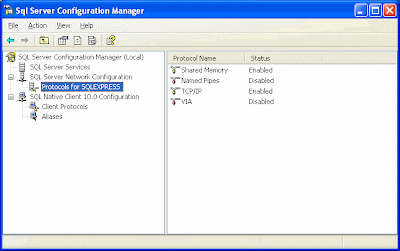
As SQL Server magazine puts it, "Out of the box, SQL Server Express's network connectivity settings aren't enabled". Talk about an understatement! First, find an run the "SQL Server Configuration Manager", and go to the "SQL Server Network Configuration" section"
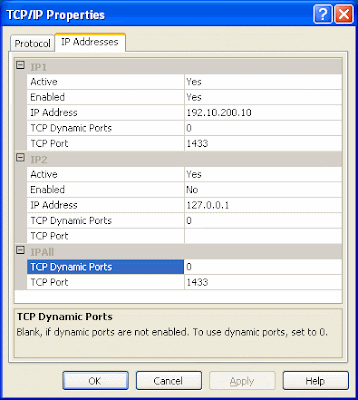
Enable the TCP/IP protocol, and then go to the "IP Addresses" tab. Make sure "TCP Dynamic Ports" are enabled by setting them to zero (?)
Use the TCP Port 1433 where required.
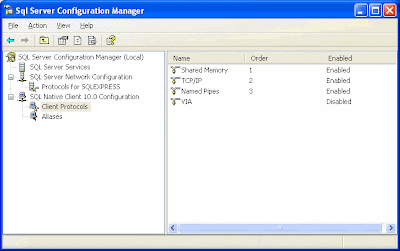
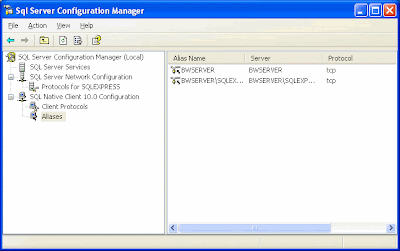
Make sure that under the "Native Client Configuration" that TCP/IP is enabled in the "Client Protocols" section and in the "Aliases" section.
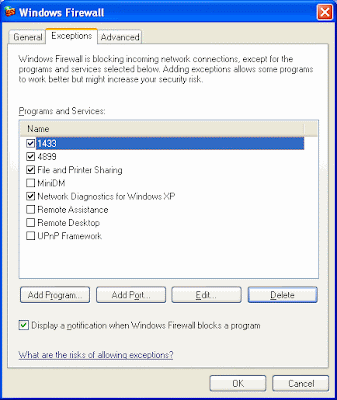
Now go to the Windows Firewall and open port 1433 for the local network
Next, in the SQL Server Management Studio, go to the server properties and select "Connections". Make sure "Allow remote connections to the Server" is selected.
At this point one would assume that workstations can now connect to the server. Not exactly. You still need to install the "SQL Server Native Client" on the workstations, which is contained in the "Microsoft SQL Server 2008 Feature Pack, August 2008" download under the heading "Microsoft SQL Server 2008 Native Client", which is an MSI package requiring Windows Installer 4.5. After installing sqlncli.msi on each workstation, you can set up the ODBC connection to the server, and it should work. In theory. Watch this space.
Tuesday, February 10, 2009
National Productivity Month is April 2009
Our darling caretaker President has announced the date for elections: Wednesday 22 April 2009. He couldn't have picked a worse date if he tried.
Not only is it a Wednesday, but he selected the only week in April that was until then a full working week. So far we have public holidays on 10th, 13th and 27th April, not to mention 1st May. Now add 22 April and the traditional "National Productivity Week" from 27th April to 1st May, becomes National Productivity Month, from 1st April to 1st May. That's17 18 working days in a month. The mind boggles.
Not only is it a Wednesday, but he selected the only week in April that was until then a full working week. So far we have public holidays on 10th, 13th and 27th April, not to mention 1st May. Now add 22 April and the traditional "National Productivity Week" from 27th April to 1st May, becomes National Productivity Month, from 1st April to 1st May. That's
Labels:
Business,
Politics,
Productivity
Wednesday, February 04, 2009
Hard Drive Temperature Is Critically Important
I learnt the hard way that an overheated hard drive is something to avoid: once the drive overheats it becomes permanently damaged, and loses data. Spinrite refuses to run when the drive gets too hot, because it's the quickest way of destroying data. So I use HDTune to monitor the temperature of my drive while I'm working.
This has already saved my drive a few times, because I can't always work in an airconditioned office. The other day I hit on a brainwave: instead of buying a USB-powered fan or notebook cooler, why not use a device found in most kitchens: a "Cake Cooling Tray"? I paid R39.00 (less than $4) from "@home, the homeware store" in our local shopping mall.
It measures 349mm x 235mm x 19mm and it fits easily into my laptop bag. It's silent, unobtrusive, and works like a charm. It costs a fraction of the price of a specialised fan (see photo above).
There is also hdTempLogger but I haven't tested it.
Labels:
Hardware,
Temperature
Subscribe to:
Posts (Atom)