This follows on from
Learning Clarion (Part 6). In the lesson below, we’ll create the application’s reports. But first, we need to tidy up the data.
Extra Lesson: Tidy Up the Data
Use the "Save and Exit" button to close the LCLesson app. If the "Start Page" is not visible, click on the "Start Page" toolbar icon, and then click on "Dictionaries". Click on the "Location" link for LCLesson, to open the folder where the files are stored: "C:\Users\Public\Documents\SoftVelocity\Clarion11\Lessons\LearningClarion".
Find and rename the following files, changing the file extension from .tps to .tps.old:
STATE.tps
ORDER.tps
PRODUCT.tps
DETAIL.tps
Next, go to the "Solution" folder and select the following 4 files:
STATES.tps
ORDERS.tps
PRODUCTS.tps
DETAIL.tps
Once they are selected, press Ctrl-C to copy them. Go back to the "LearningClarion" folder and press Ctrl-V to paste these files. Rename STATES to STATE, ORDERS to ORDER, PRODUCTS to PRODUCT. It is always best to name your tables in the
singular. Close the folder and return to the
Clarion "Start Page".
Click on the "LCLesson" dictionary to open LCLesson.dct. Right-click on the "State" table and select "Browse Table" from the popup menu.
The "Convert File" dialog should appear because our index names are slightly different to the "Solution" version. Click on the "Convert the file and backup the existing file ..." option and click "OK".
Once the data has been displayed, click on the "x" next to "State.TPS" to close the data file. Right-click on "Product" and select "Browse Table" and follow the same steps. "Order" opens without conversion, but "Detail" will also need some help. Open all the tables just to make sure. The "Phone" table is empty. The "Customer" data was imported in Lesson 5. Click on the green "Save and Close" button.
Make a backup of your work. Change to "Solutions (Projects and Applications)" in the "Start Page", and open the "LCLesson" application once again.
Lesson 12: Reports
The next item to cover is adding reports. First, we’ll create a simple customer list to introduce you to the
Report Designer. Then we’ll create an Invoice Report to demonstrate how you can easily create Relational reports with multi-level group breaks, group totals, and page formatting. Then we’ll copy the Invoice Report and limit the copied report to print an invoice for only one customer at a time.
Updating the Main Menu
First, we need to add menu selections, so the user can call the reports, and so the Application Generator will call the appropriate "ToDo" procedures.
Select the "Main" procedure and click on the "Window" button to the right to open the window designer.
Right-click on the menu bar, and choose "Edit Menu" from the popup menu. This will open the
Menu Editor.
In the Menu Editor, click on the "P&rint Setup" item, and then click on the "Add new Item (Insert)" button on the toolbar. This will add a new menu item just below the "P&rint Setup" item.
In the "Text" property, change it to read "Print &Customer List" and press the TAB key. Click on the "Actions..." link at the bottom of the properties pad.
Change the "When Pressed" selection to "Call a Procedure". In the "Procedure Name" field, type in "CustReport" and enable "Initiate Thread". Click "OK".
Click on the newly created "Print &Customer List" item, and then click on the "Add new Item (Insert)" button once more.
Type "Print &All Invoices" in the Text property entry, and press the TAB key. Click on the "Actions..." link at the bottom of the properties pad.
Change the "When Pressed" selection to "Call a Procedure". In the "Procedure Name" field, type in "InvoiceReport" and enable "Initiate Thread". Click "OK".
For the third menu item, set the text to "Print &One Customer’s Invoices" and set the procedure to "CustInvoiceReport" as shown. Click "OK", "Save and Close", "Save and Close" and "Accept changes" to
save your work and return to the main procedure display.
Creating the Report
Click on the "CustReport (ToDo)" empty procedure and then on the "Properties" button.
Click on the "Defaults" tab and notice that you can choose 3 different page sizes for reports. Because this program is intended for users in the USA, click on the "Report (Paper size Letter - Portrait)" option and click on the "Select" button to continue.
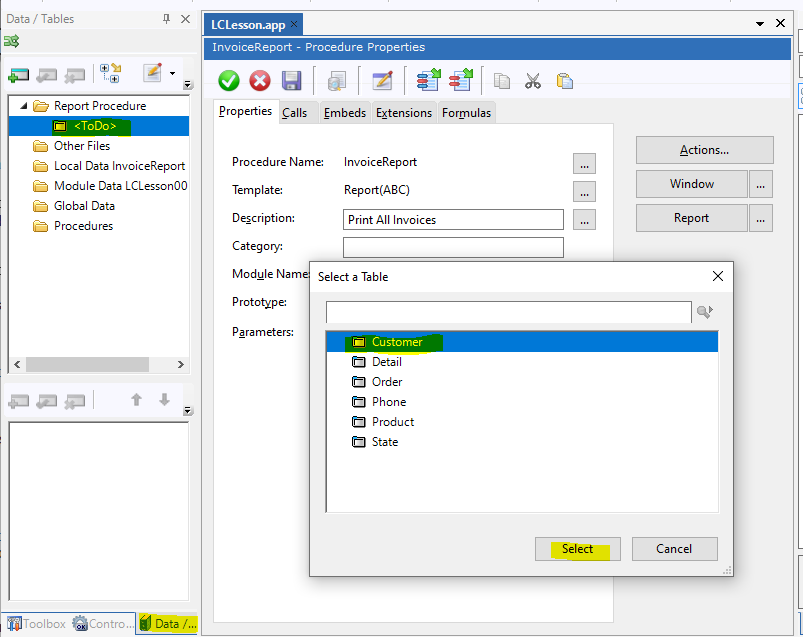
Fill in "Print a list of Customers" in the Description field. Click on the "Data/Tables" pad, and double-click on the "<ToDo>" entry. Choose the "Customer" table and click "Select". Click on the green "Save and Exit" button and "Accept changes". Then click on the "Report" button. We are going to use a Control Template, so it is always a good idea to
save your work before doing so.
The Report Designer appears. Here you can visually edit the report and its controls. The Report Designer represents the four basic parts of the REPORT data structure by showing the Page Header, Detail, Page Footer, and Form as four "bands." Each band is a single entity that prints all together. See the "IDE User’s Guide" lesson 8 on the Report Designer for more information on the parts of the report and how the print engine generates them ("C:\Clarion11\docs\IDEUsersGuide.pdf").
For this report, you’ll place page number controls in the header, then place the columns from the Customer table in the Detail band.
Click on the "Control Templates" pad, and drag the "ReportPageNumber" template to the Page Header band as shown.
Select the STRING control in the "Toolbox" pad, and drag the control to the top left of the Page Header band, and drop. In the Properties Pad, set the "Text" property to "Page Number:". Tidy up the two items so they work together.
Select the "Data/Tables" pad, and double-click on the "Customer" table. Choose the "KeyCustNumber" key and click on the "Select" button. This will cause the report to sort the data by CustNumber.
Use the grab handles to adjust the report header size, and to make more space for the fields in the detail band. Drag the "Company" field to the top left of the detail band, as shown.
Drag the "FirstName" and "LastName" field to the line below "Company". Put the "Address" field on the line below, and finish off with the "City", "State" and "ZIPcode" fields on the last line. Drag the "CustNumber" field to the top right, and use the familiar alignment tools to neaten everything up.
Click on the drop-down list at the top of the "Properties" pad, and select "Report". This will allow us to set the properties of the report. Click on the ellipsis next to the "TextFont" property, and choose a font and size. "Arial" 10pt is suggested. You could also use a more modern font like "Cambria" or "Calibri" to match the fonts often used in Word documents.
Before we close the report, click on the "Print Preview Details" button. Click on "Details" and then use the "Add" button a few times to get several records to display. Click on "OK" to see the preview, and then "Close". Click on the green "Save and Close" button and "Accept Changes" to
save your work.
Click on the "Start without Debugger (Builds Solution)" button to run the application. Use the "File" menu and click on "Print Customer List" to preview the actual report, and to do a printout if you want to. "Exit" the application when done. Don't leave it running before you return to the
Clarion IDE.
An Invoice Report
Next, we will create one of the most common types of reports. An invoice will make use of most of the tables in the data dictionary, demonstrating how to create group breaks and totals. It will also show you how to control pagination based on group breaks.
Select the empty "InvoiceReport" procedure and then click on the "Properties" button. Change to the "Defaults" tab, choose "Report (Paper size Letter - Portrait)" and click on the "Select" button. Type in "Print All Invoices" in the "Description" field.
Go to the "Data/Tables" pad and double-click on the "<ToDo>" entry. Choose the "Customer" table and click "Select".
Double-click on the "Customer" table and select the "KeyCustNumber" key.
Make sure the "Customer" table is still highlighted, and click on the "Add" button just above it. Select the "Order" table. With the "Order" table highlighted, click on the "Add" button and select the "Detail" table. Check the "Inner" join option if asked. With the "Detail" table highlighted, click on the "Add" button and select the "Product" table.
The report will process all the Customer table rows in CustNumber order. It will process all the Orders for each Customer. Each Order will print all the related Detail rows. Each Detail row will lookup the related Products table row. Click on the "Accept changes" button and then on the "Report" button. Use the "Properties" pad drop-down to select "Report" and change the font to something suitable for your company reports. I chose "Cambria" again.
The "Report Form" band prints once for each page in the report. Its content is only composed once, when the report is opened. This makes it useful for constant information that will always be on every page of the report. Go to the "Toolbox" pad and drag a "STRING" control to the top middle of the "Report Form" band. Change its "Text" property to "Invoice", the "Justification" property to "CENTER", "Bold" to "True" and "Size" to 24. Use the grab handles to make the control span the full width of the band, as shown.
Drag another "STRING" control to just below the "Invoice" control. Change its "Text" property to your company/client name, the "Justification" property to "CENTER", "Italic" to "True" and "Size" to 14. Use the grab handles to make the control span the full width of the band, as shown.
Populating the Detail Band
The Detail band will print every time new information is read from the lowest level "Child" table in the Table Schematic. For this Invoice report, the lowest level "Child" table is the "Detail" table (remember that Product is a Many to One "lookup" table from the "Detail" table).
From the "Data/Tables" pad, select the "Detail" table and drag the "Quantity" field to the top-left corner of the "Detail" band.
Then drag and drop the "ProdNumber" field from the "Detail" table to the right of the "Quantity" control.
Drag and drop the "ProdDesc" field from the "Product" table to the right of the "ProdNumber" control.
Return to the "Detail" table and drag and drop the "ProdAmount" field to the right of the "ProdDesc" control.
Highlight "Local Data InvoiceReport" in the "Data/Tables" pad, then press the "Add" button. This local variable will be used to display the total price for each line item. Type "LOC:ItemTotal" in the "Column Name" field. Change the "Data Type" to "DECIMAL". Set the "Characters" to "7" and the "Places" to "2" and click "OK".
Drag "LOC:ItemTotal" and drop it to the right of the last control placed. Move all the controls to the top of the Detail band, aligned horizontally, then resize the band, so it is just a little taller than the controls. Also, modify the properties of the "DET:ProdAmount" and "LOC:ItemTotal" controls to change the "Justification" to "RIGHT" and the "Offset" to "2".
Adding Group Breaks
We need to print different information on the page for each Invoice. Therefore, we need to create BREAK structures to provide the opportunity to print something every time the "Order" table information changes and every time the "Customer" table information changes.
Click on the "Detail" band, and then choose "Report Designer", then "Bands", "Surrounding Break".
Use the ellipsis to the right of the "Variable" entry to choose "CUS:CustNumber", or just type it in. Change the "Label" from "break1" to "CustNumberBreak". Then click "OK". A "Break (CUS:CustNumber)" band appears above the Detail band. Repeat the process to choose "ORD:OrderNumber" for the second break. Change the "Label" from "break2" to "OrderNumberBreak".
Click on the "Break (ORD:OrderNumber)" band, and then select "Report Designer", "Bands", "Group Header". The "Group Header(ORD:OrderNumber)" band appears above the Detail band. This band will print every time the value in the ORD:OrderNumber column changes, at the beginning of each new group of rows. We will use this to print the company name, address, along with the invoice number and date.
Click on the "Break (ORD:OrderNumber)" band, and then select "Report Designer", "Bands", "Group Footer". The "Group Footer(ORD:OrderNumber)" band appears below the Detail band. This band will print every time the value in the ORD:OrderNumber column changes, at the end of each group of rows. We will use this to print the invoice total.
Click on the "Group Footer(ORD:OrderNumber)" band, and change the "PageAfter" property to "1" as shown. This causes the print engine to print this band, then initiate Page Overflow. This will compose the Page Footer band, issue a form feed to the printer, then compose the Page Header band for the next page.
Click on the "Break (ORD:CustNumber)" band, and then select "Report Designer", "Bands", "Group Footer". The "Group Footer(ORD:CustNumber)" band appears below the Detail and "Group Footer(ORD:OrderNumber)" bands. This band will print every time the value in the ORD:CustNumber column changes, at the end of each group of rows. We will use this to print invoice summary information for each company. Click on the "Group Footer(ORD:CustNumber)" band, and change the "PageAfter" property to "1".
Populating the Group Header Band
Click on the "Customer" table in the "Data/Tables" pad, and drag the "Company" control to the top-left corner of the "Group Header(ORD:OrderNumber)" band. Drag the "FirstName" and "LastName" controls to the line below, and then the "Address" control below them. Put the "City", "State" and "ZIPcode" controls on the fourth line. Tidy up the controls as before.
Click on the "Order" table in the "Data/Tables" pad, and drag the "OrderNumber" control to the top-right corner of the "Group Header(ORD:OrderNumber)" band. Set its "Bold" property to "True". Drag the "OrderDate" control to the line below it. Change its "Justification" property to "RIGHT".
Go to the "Toolbox" pad and drag a "STRING" control to the left of the "OrderNumber" control. Click on the "Edit Value" entry in the pop-up menu, or at the bottom left of the "Properties" pad. Change the text value to "Order Number:" and click "Accept".
Drag another "STRING" control below the first one, and change its text to "Order Date:". Tidy up the controls so they look neat. Drag the bottom of the "Group Header(ORD:OrderNumber)" downwards to make some space for a line of text labels that will correspond to the controls in the "Detail" band.
Drag four "STRING" controls to the bottom of the "Group Header(ORD:OrderNumber)" band, and change their text to "Quantity", "Product", "At" and "Item Total" as shown here. Use the "sight lines" when dragging them to the right position, and tidy them up, so they are all at the same height.
Drag a "LINE" control and drop it in some open space in the "Group Header(ORD:OrderNumber)" band. Then move it down to below the "Quantity" control. Move the right-hand grab handle across until it is under the right end of the "Item Total" control.
Set the "LineWidth" property to "5" and change the "LineColor" to "ControlDark", so we don't have a thick, ugly black line. Check that the "Height" value is 0, so we have a straight line.
Populating the Invoice Group Footer Band
Drag a "STRING" control to the "Group Footer(ORD:OrderNumber)" band, and place it under the "At" column. Change its "text" property to "Order Total:". Drag a second "STRING" control and place it to the right of the first control. Set its "VariableString" property to "True", and set the "Use" property to "LOC:ItemTotal" or use the ellipsis to select it from the Local Values. Type "@N9.2" into the "Text" property. Change the "TotalType" property to "Sum", and choose "OrderNumberBreak" for the "Reset" property. This will add up all the "LOC:ItemTotal" contents for the Invoice and will reset to zero when the value in the "ORD:OrderNumber" column changes.

Select the LINE control we created in the Invoice Header. Note the "X" value of the line. Then use the "Edit" menu and choose "Copy". Click in the Invoice Footer band and use the "Edit" menu to "Paste". Twice. Set the "X" values of each new line to the same value as the original line. Make sure the "Height" values are both 0. Change the "Y" value of the first copy to 0, and the second one to 250. The "Order Total" controls should now have a line above and another below, equally spaced. Tidy up the controls if necessary. Reduce the height of the Invoice footer band.
Populating the Customer Group Footer Band
Drag two "STRING" controls to the middle of the "Group Footer(CUS:CustNumber)" band. The text for the first one should be "Invoice Summary for:" and the second one "Total Orders:".
Go to the "Data/Tables" pad, and click on the "Local Data InvoiceReport" section. Click on the "Add" button. Type in "LOC:InvoiceCount" in the "Column Name" entry. Change the "Data Type" to "LONG" and the "Screen Picture" to "@N3" and click "OK". Then click "Cancel" when the empty "Column Properties" dialog box comes up.

Drag the "LOC:InvoiceCount" control to the right of the second "STRING" control. Check that its "VariableString" property is "True". Set the "TotalType" to "Count" and select "CustNumberBreak" for the "Reset" property. This is the same type of total column that we placed in the "ORD:OrderNumber" group footer, but it will only reset when "CUS:CustNumber" changes. Select "OrderNumberBreak" for the "Tally" property. This total column will count the number of invoices that print for each customer. The Tally list allows you to select the point(s) at which the total increments. By selecting "OrderNumberBreak" from the list, the count will only increment when a new invoice begins.

From the "Toolbox" control pad, drag a "STRING" control right of the Invoice Count string you just placed. Set the "VariableString" property to "True". Set the "Use" property to "LOC:ItemTotal", the "TotalType" to "Sum", and the "Reset" property to "CustNumberBreak". This is the same type of total column that we placed in the "ORD:OrderNumber" group footer, but it will only reset when "CUS:CustNumber" changes.
Go to the "Data/Tables" Pad. Select the "Customer" table and drag the "Company" control just right of the "Invoice Summary for:" string you placed. Tidy up the controls, and resize the bands to make them look neater. Click on the green "save and Close" button and the "Save and Exit" button. Then "Accept changes" to
save your work.
Adding a Formula
Select the report once again and click on the "Properties" button.
Click on the "Formulas" tab in the Procedure Properties dialog, and the "Insert" button to open the
Formula Editor.
The Formula Editor design dialog appears. Type "Item Total Formula" in the "Name" entry. In the "Class" entry, select "Before Print Detail" from the Template Classes list. The "Before Print Detail" class tells the Report template to perform the calculation each time it gets ready to print a Detail. Press the ellipsis button for the Result entry. Highlight "Local Data InvoiceReport" in the Tables list, select "LOC:ItemTotal" from the Columns list, then click the "Select" button.
Press the "Data" button in the Operands group. Highlight the "Detail" table in the Tables list, select "Quantity" from the Columns list, then click on the "Select" button.
This places the "DET:Quantity" column in the "Statement" entry for you. The Statement entry contains the expression being built, and you can also type directly into it to build the expression, if you wish. Click on the "*" button in the "Operators" group. Then click on the "Data" button in the "Operands" group.
Choose the "Detail" table in the Tables list, then the "ProdAmount" from the Columns list, and click on the "Select" button.
Now you should see the complete calculation in the statement entry: "DET:Quantity*DET:ProdAmount". Click on the "Check" button to check for syntax errors. Click on the green "OK" button to close the Formula Editor design window.
Notice the new "Item Total Formula" has been added. Click on "Save and Exit" and "Accept changes" to
save your work.
Try running the application by clicking on the "Start without Debugger (Builds Solution)" button. Select the "Print All Invoices" report and preview it. The first page is displaying the invoice correctly, but on the third page there are "ghost" invoices, with an invoice number of zero. We need to fix this.
Row Filters vs Inner Joins
One option would be to return to the report properties, and click on the "Actions" button. Then click on the "Report Properties" button and type in
"ORD:OrderNumber <> 0" in the "Record Filter" entry. It's not the best way to fix it, but click "OK" and "OK" and try the report now.

This will eliminate all the customers who have not ordered anything. Internally, the Report Template generates a VIEW structure for you. This VIEW structure, by default, performs an
outer join on the tables you placed in the Table Schematic. Outer join is a standard term in Relational Database theory: it just means that the VIEW will retrieve all Parent table rows, whether there are any related Child table rows or not.
If it retrieves a Parent row without a Child, the columns in the Child table are all blank or zero, while the Parent table’s columns contain valid data. Therefore, this is the condition for which we test.
"ORD:OrderNumber <> 0" checks to see if the ORD:OrderNumber column has any value in it other than zero. Since "ORD:OrderNumber" is the key column in the "Order" table that creates the link to the related Customer table row, it must contain a value if there are existing Order table rows for the current Customer.
If ORD:OrderNumber does not contain a value other than zero, the current Customer table row is skipped ("filtered out"). This eliminates printing Parent rows without related Children (in this case, any Customers without Orders).
This means that a filter would work. However, since the VIEW structure can do the filtering required, there is a better way. This is the "inner join". What this means is that there is a Customer row only if there is a related Order row. This makes the VIEW smaller, and thus more efficient than a filter.
Return to the "Report Properties" dialog and remove the "Record Filter" entry.
Open the "Data/Tables" pad and select the "Order" table. Click on the "Change" button and check the "Inner" box. This changes the join type from an
Outer Join to an
Inner Join which only selects related rows from "Customer" and "Order". Click "OK".
Click on the "Window" button in the properties tab. This will open the report progress window in the Window Designer. Click on the title bar on the window, and change the "Text" property to "Invoice Progress...". Click on the green "Save and Close" button, and then on the green "Save and Exit" button to return to the main Application Tree. Click on "Accept changes" to
save your work. Try running the "Print all Invoices" report again.
A Range Limited Report
Next, we will limit the range of rows that will print.
From the Application Tree, choose the "InvoiceReport" procedure. Go to the "Application" menu and select "Copy Procedure".
The New Procedure dialog appears. Type "CustInvoiceReport" in the entry box, then click "OK". Click on the "properties" button for the new (copied) procedure which has replaced the "<ToDo>" placeholder. Change the "Description" entry to "Print Customer Invoices".
Change to the "Embeds" tab and click on the "Collapse All" button. Then click on each of these entries to expand them: "Local Objects", "Abc Objects", "Window Manager (ReportManager)".
Find the first "Init" procedure, click on "CODE", then "Open Files". Click on the "Insert" button.
Choose "Source" and click "Select". This embed point is at the beginning of the procedure, before the report has begun to process. It’s important that the tables for the report already be open because we will call another procedure for the user to select a "Customer" row. If the tables for the report weren’t already open, the procedure we call would open the "Customer" table for itself then close it again and we would lose the data that we want to have for the report. This has to do with multithreading and the Multiple Document Interface (MDI). See "THREAD" in the Language Reference for more on this.
Type in "GlobalRequest = SelectRecord" and click on the green "Save and Close" button. This code sets up a Browse procedure to select a row (it enables the Browse procedure’s "Select" button).
Make sure the SOURCE you just added is still selected. Then click on the "Insert" button.
Choose "Call a procedure" then click the "Select" button.
Select "BrowseCustomers" in the list, then press the "OK" button. This will generate a procedure call to the BrowseCustomers Browse procedure to allow the user to select which Customer’s Invoices to print.
Notice that there are now two entries displayed under the embed point. At each embed point you can place as many items as you want, mixing Code Templates with your own SOURCE or PROCEDURE Calls. You can also move the separate items around within the embed point using the arrow buttons, changing their logical execution order (the first displayed is the first to execute). Note well that moving them will change the assigned Priority option setting for the moved item if you attempt to move a higher priority item in front of another with a lower priority setting.
Set the Range Limit
Go to the "Properties" tab, and then press the "Actions" button. In the Properties dialog, press the "Report Properties" button.
The Report Properties dialog appears. This dialog allows you to set either
Row Filters or
Range Limits (along with Hot Columns and Detail Filters).
Row Filters and Range limits are very similar. A Row Filter is a conditional expression to filter out unwanted rows from the report, while a Range Limit limits the rows printed to only those matching specific key column values. They can both be used to create reports on a subset of your tables, but a
Range Limit requires a key and a Row Filter doesn’t. This makes a
Row Filter completely flexible, while a
Range Limit is very fast. You can use both capabilities if you want to limit the range, then filter out unneeded rows from that range.
Select the "Range Limits" tab. Press the ellipsis button for the "Range Limit" entry. The "CUS:CustNumber" control, the only logical choice, is automatically populated. Leave "Current Value" as the "Range Limit Type".
Current Value indicates that whatever value is in the column at the time the report begins is the value on which to limit the report. Since the user will choose a Customer row from the BrowseCustomer procedure, the correct value will be in the CUS:CustNumber column when the report begins. Now press the "OK" button. Press the next "OK" button, followed by the green "Save and Exit" button.
Press the "Accept changes" button to
save your work.
Click on the "Start without Debugger (Builds Solution)" button to run the application. Use the "File" menu and click on "Print One Customer's Invoices". Double-click on Customer 1 to preview the report for the only customer with any invoices. "Exit" the application when done and return to the IDE. Make a
backup of your work.
A Single Invoice Report
Next, we will print a single invoice from the Browse list of orders.
In the Application Tree, highlight the "CustInvoiceReport" procedure. Go to the "Application" menu and click on "Copy Procedure". Type "SingleInvoiceReport" in the entry box, then press the "OK" button.
Welcome to the (wild and) wonderful world of
Clarion programming. If you didn't get this message, you are fortunate. My
colleagues at Clarion Hub tell me it has something to do with
using a formula. It is better to "just code it". More on that later. For now, we will use a workaround, by deleting the formula, and then putting it back later, after we have copied the report. Click on "Close Application".
Run the
Clarion IDE and open "LCLesson" once again. Since we have been diligent about saving our work, click on "Last Saved" to recover the application.
Select "CustInvoiceReport" and then click on the "Formulas" button.
Select the "Item Total Formula" and click on the "Delete" button, followed by "Yes". Click on the green "Save and Exit" button.
In the Application Tree, highlight the "CustInvoiceReport" procedure. Go to the "Application" menu and click on "Copy Procedure". Type "SingleInvoiceReport" in the entry box, then press the "OK" button.
When we copy a procedure that calls other procedures, we have the option to call other procedures or not. In this case, we want to continue to use the procedures that "CustInvoiceReport" procedure is using, so click on the "Same" button.
Adding the Formula again. Twice
Select the "CustInvoiceReport" once again and click on the "Formulas" button, and the "Insert" button to open the
Formula Editor.
The Formula Editor design dialog appears. Type "Item Total Formula" in the "Name" entry. In the "Class" entry, select "Before Print Detail" from the Template Classes list. The "Before Print Detail" class tells the Report template to perform the calculation each time it gets ready to print a Detail. Press the ellipsis button for the Result entry. Highlight "Local Data CustInvoiceReport" in the Tables list, select "LOC:ItemTotal" from the Columns list, then click the "Select" button.
Press the "Data" button in the Operands group. Highlight the "Detail" table in the Tables list, select "Quantity" from the Columns list, then click on the "Select" button.
This places the "DET:Quantity" column in the "Statement" entry for you. The Statement entry contains the expression being built, and you can also type directly into it to build the expression, if you wish. Click on the "*" button in the "Operators" group. Then click on the "Data" button in the "Operands" group.
Choose the "Detail" table in the Tables list, then the "ProdAmount" from the Columns list, and click on the "Select" button.
Now you should see the complete calculation in the statement entry: "DET:Quantity*DET:ProdAmount". Click on the "Check" button to check for syntax errors. Click on the green "OK" button to close the Formula Editor design window.
Notice the new "Item Total Formula" has been added. Click on "Save and Exit" and "Accept changes" to
save your work.
Now repeat the same process to add the missing formula to the new report, "SingleInvoiceReport".
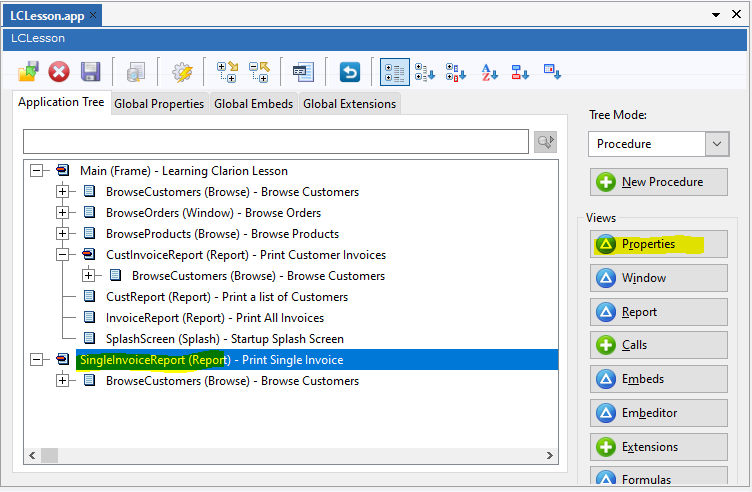
Notice how the copied procedure appears unattached at the bottom of the application tree. We'll "connect the lines" after we finish with the report.
A Single Invoice Report (Continued)
With "SingleInvoiceReport" selected, click on the "Properties" button and change the description to read "Print Single Invoice" and then click on the green "Save and Exit" button. Click on the "Embeds" button because we want to remove some embedded code.
Click on the "Expand filled nodes" button to show the user's added code to the generated code. The red highlights at each node will tell you that there is some embedded code further down the tree. At the bottom, you can see two entries of embedded code, which we want to remove.
Click on the "Show Filled Only" button, and un-click the adjacent "Show Priority Labels" button. This will just show the stuff we want to remove. Click on the line that reads "SOURCE (GlobalRequest = SelectRecord)" and then click on the "Delete" button, followed by "Yes". Do the same for the next line that reads "PROCEDURE BrowseCustomers".
Change the Table Schematic
We need to change the order of the tables in the Table Schematic. We’ll end up with all the same tables, but instead of the "Customer" table as the primary table (first table in the Table Schematic), we need the "Order" table to be the primary table for the procedure, so we can easily limit the range to a single invoice.
Highlight the "SingleInvoiceReport" procedure, and select the "Data / Tables" Pad. Click on the "Customer" table, then press the "Delete" button. The tables disappear, and are replaced by "<ToDo>".
Click on the "<ToDo>" and then click on the "Add" button. Choose the "Order" table from the list, and click "Select".
Next, click on the "Order" table and then the "Change" button. Select the key called "KEYORDERNUMBER" and click on the "Select" button. So now we can use the key to find the Order number we want to print out.
Click on the "Order" table again, and then the "Add" button. Select the "Detail" table and click "Select".
Now repeat the same process to add the "Product" table as a related table to "Detail".
Go back to the "Order" table, click "Add" and choose the "Customer" table. Click the "Select" button. Now we have all the related tables needed to display the data in an invoice, and we have the correct key on the "Order" table to be able to specify exactly which single invoice to print.
Return your attention to the "SingleInvoiceReport" procedure in the main window, and then click on the "Properties" button.
From the "properties" tab click on the "Actions" button. Click on the "Report Properties" button and change to the "Range Limits" tab. Use the ellipsis button to select "ORD:OrderNumber" as the Range Limit Field, and leave the Range Limit Type as "Current Value". This indicates that whatever value is in the column at the time the report begins is the value on which to limit the report. Since the user will run this report from the BrowseOrders procedure, the correct value will be in the ORD:OrderNumber column when the report begins. Click "OK", and "OK" again.
Press the "Accept changes" button to save your work. Click on the "Report" button because we need to make a few changes.
Select the "Break(CUS:CustNumber)" band and use the delete key to remove it. This removes not only the Group Break, but also the Group Footer that was associated with it. Click on the green "Save and Close" button to return to the Procedure Properties dialog. Click on the green "Save and Exit" button in the Procedure Properties dialog to close it. Click on the "Accept Changes" button to save your work.
Now that we have a report, we need to connect it to the rest of the application, so it can be used. Click on the "BrowseOrders" procedure, and then on the "Window" button.
From the "Control Templates" Pad, find the "BrowsePrintButton" collection and drag the "Browse on Order" control to the right of the "Delete" button as shown. Right-click on the new button and select "Properties" from the pop-up menu.
Change the Text property to "&Print Invoice". Change the "Use" property to "?PrintInvoice". Click on the "Actions ..." link as shown.
Change the "When Pressed" property to "Call a Procedure" and then use the drop-down list to select "SingleInvoiceReport". Click "OK".
This Control Template is specifically designed to run a range-limited report based on the currently highlighted row in the list box we selected (Browse on Orders). The Order table row buffer will contain the correct value to allow the Current Value Range Limit on the "SingleInvoiceReport" to work. It also automatically adds this button's action to the popup menu for the browse.
Click on the green "Save and Close" button, and then on the "Accept Changes" button to save your work.
Notice how the "SingleInvoiceReport" procedure is now connected to the "BrowseOrders" procedure. Try running the application by clicking on the "Start without Debugger (Builds Solution)" button, or press Ctrl-F5. Then
make a backup of your work.
OK, What Did I Just Do?
Here's a quick recap of what you just accomplished:
- You added several menu items to your main menu.
- You created a simple Customer List report.
- You created a relational report to print all Invoices.
- You range-limited a report to print Invoices for a single customer.
- You range-limited a report to print a single Invoice from the current row highlighted in a Browse list.
Now we'll look at where to go next.
What's Next?
Here is the completed application, created from scratch and without the help of the wizards:
While this lesson application is by no means a "shrink-wrap" program, it has demonstrated the normal process of using the Application Generator and all its associated tools to create an application that actually performs some reasonably sophisticated tasks. Along the way, you have used most of
Clarion’s high-level tool set, and seen just how much work can be done for you without writing source code. You have also seen how just a little embedded source can add extra functionality to the template-generated code, and how you can easily override the default ABC Library classes.
A Short Resource Tour
You have many resources at your disposal to help you with your
Clarion programming. Here is a short tour of two of the more important ones that you have right at your fingertips:
- Choose "Context Help" from the "help" menu.
This is the Contents page for Clarion’s extensive on-line Help system.
- Press the "Contents" tab in the left pane. Examine the FAQ sections.
This opens Clarion’s on-line Help file and takes you to a section of commonly asked questions and their answers. This list of topics is the first place you should look whenever you ask yourself any question about Clarion programming that starts with "How do I ... ?" These topics answer many of the most common questions that newcomers to Clarion have, so quite often, you’ll find the answer is here.
- Examine the "Guide to Examples" section.
This topic provides jumps to the discussions of all the example programs that come with Clarion. Here you’ll find the various tips, tricks, and techniques that the examples demonstrate, so you can adapt them for use in your own programs.
- Examine the "What's New?" section.
This topic always gives you the latest, up-to-date information about the most current release of Clarion you have installed. You should always go through this section any time you get a major upgrade or interim release. There are generally a few last-minute details which you will find are only documented in this section. That makes it well worth the reading.


No comments:
Post a Comment